

New Google Tag Manager Preview Mode (October 2020) – Tag Assistant
We like surprises, don't we? Whenever we spotted a surge of comments on forums and social media about a huge change to the Google Tag Manager interface recently, it definitely...


We like surprises, don’t we? Whenever we spotted a surge of comments on forums and social media about a huge change to the Google Tag Manager interface recently, it definitely came as a bit of a shock. We had no idea it was coming but perhaps in hindsight, it shouldn’t have been that big a surprise…
The old Google Tag Manager preview and debug mode is gone – as of October 2020, you will no longer see a preview pane at the bottom of your website when you want to test your tags. Instead, you will see a completely separate window (or tab, if you have the Tag Assistant Chrome extension installed) which will be used for debugging.
Seeing as it’s almost Halloween, let’s talk about the changes and work out if it’s a trick or if we’re in for a treat.
Why has the Google Tag Manager preview mode changed?
We’d hazard a guess that the increasing number of browsers clamping down on third party cookies sped up the change. The old preview and debug mode used third-party cookies, while the new debugging process uses first-party storage only.
That’s not the only difference though – the suite of Google tools is evolving and the new interface is much more in-line with debugging for server-side tagging which is likely to become much more common in future, so it makes sense to have commonality between GTM variants for ease of use.
What are the advantages of the new Google Tag Manager preview mode?
- Your preview pane no longer takes up screen space on your website. Remember when you wanted to track clicks on a button in the bottom-right corner and it was almost impossible because the preview pane arrow was in the way? That will no longer be an issue.
- Your debugging will carry across multiple pages. Remember when you wanted to check the variables on a page but when you clicked on a link, the next page loaded and you couldn’t see what they were? Again, no longer a problem, you can see all actions across your session within the new debug mode.
- If you’ve got multiple screens, you can have your debug mode on one monitor and you can have the website in another – this is the ideal setup for all you multi-screen folks out there.
- Also, that cookie thing. It should future proof the ability to debug even if browsers block third-party cookies. That’s kind of important.
What does the new Google Tag Manager preview mode look like?
Gone is the orange bar at the top of the GTM interface telling you preview mode is enabled. Now, you’ll see something like this when you click on ‘Preview’.
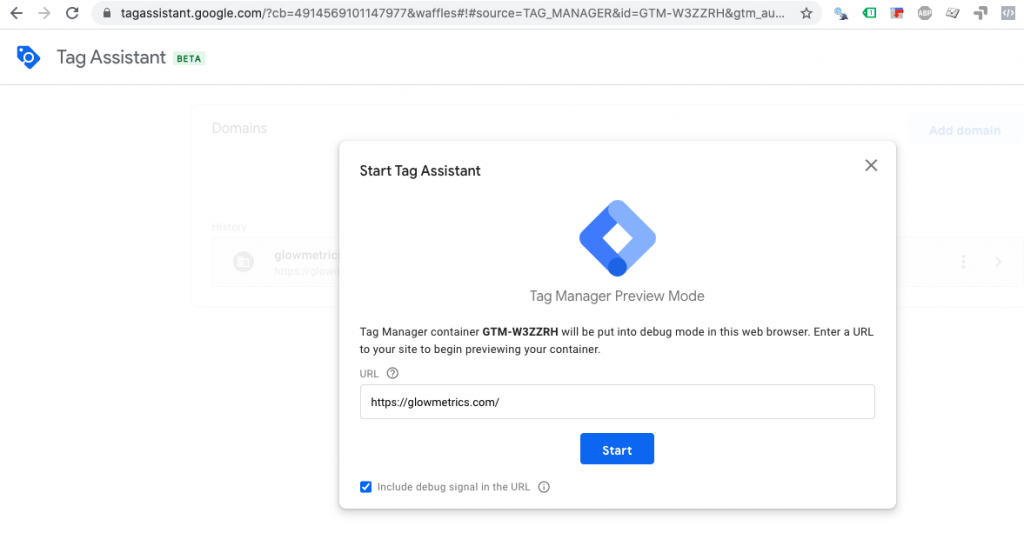
Notice it says ‘Tag Assistant’ at the top and in the URL? Yep – I guess the old ‘Tag Assistant’ Chrome extension is now taking centre stage when it comes to debugging – and as mentioned earlier, if you install it, you can run the debugger in a separate tab rather than a new window.
Once you click ‘Start’, the debugger will connect to your website and once it loads, you’ll see a notification in the bottom right that says ‘Debugger Connected’ and you’re good to go. This is the only thing you’ll see on the website itself and even this can be minimised if required.

Now if you go back to your other tab, you’ll see the debugging information which should look familiar – it is pretty similar to the old Preview & Debug pane, aside from the fact it sits in its own tab now.

If you’ve used GTM’s Preview & Debug mode before, this should all be familiar. The key differences are that the ‘events’ down the left side don’t reset when you navigate from page to page. They’re maintained there which is a nice bonus. It’s also easier to copy and paste values which is handy. Finally, if you have multiple tabs open for the website, they’ll be colour-coded so you know which tab is generating which actions.
It’s a big change but it is one that’s surely been taken with future-proofing the product in mind – and with the evolution of browser privacy, tagging and the move to server-side. The positives are worth the minor inconvenience of switching between tabs for us but maybe now is a good time to invest in that second monitor for your home office!
Have you used the new debugging mode in GTM yet? Let us know your thoughts in the comments below.

Posted by
Michael Wilson
Michael is the Digital Analytics Director at GlowMetrics, implementing complex tracking for our largest clients via Google Tag Manager while leading our wider analytics work across Google Analytics, Data Studio and Optimize
Read more from Michael WilsonBrowse by Category
- Social Media
- SEM
- SEO
- Google Ads
Digital Marketing
- Google Analytics
- Google Tag Manager
- Google Opimize
Digital Analytics
Optimise your website and marketing campaign performance with Ireland’s leading digital analytics agency
Sign up to our newsletterEnjoyed reading this article? Find more like it below…

Posted by
Hannah Magorrian
Feb 29th 2024
Digital Analytics Insights
3 min read
Creating Custom Groups in Looker Studio
If you are a seasoned Looker Studio user, you are probably already familiar with creating custom groups in your data using calculated fields and CASE statements - but did you...


Posted by
GlowMetrics Staff
May 12th 2016
2 min read
GlowMetrics Awarded Google Analytics Certified Partner Status
We've some great news to share with you today, we have just been awarded Google Analytics certified partner status. Being a certified partner, we will be given insights into the...

Posted by
Georgia Sloan
Mar 28th 2024
Digital Analytics Insights
2 min read
The Discrepancy Between LinkedIn’s ‘New Followers’ Metric and Actual Page Growth
Have you been using LinkedIn's analytics to track your page's New Follower growth, only to find yourself scratching your head when the numbers don't quite add up? If so, you're...
Leave a Reply